Fotosearch Royalty Free Stock Photography
Digital images licensed by Publitek, Inc.
Fotosearch and Photosearch are trademarks of Fotosearch, LLC
All rights reserved © 2026-01-26
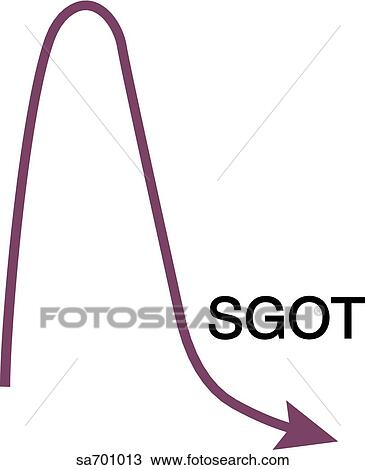
SGOT curve from graph of elevated enzyme activity versus days after onset of cardiac infarct. Drawing

SGOT curve from graph of elevated enzyme activity versus days after onset of cardiac infarct.
sa701013 | LifeART | Royalty Free
Add to Lightbox
Share Image
Keywords
anesthesiology, cardiac, cardiology, cardiothoracic, emergency, ems, enzgrap2, enzyme, infarct, medicine, nursing, pathology, sgot, surgery, thorax, vascular, stock illustration, royalty free illustrations, stock clip art icon, stock clipart icons, logo, line art, EPS picture, pictures, graphic, graphics, drawing, drawings, vector image, artwork, EPS vector arts, fine art prints, print, poster, posters, mural, wall murals, sa701013
anesthesiology, cardiac, cardiology, cardiothoracic, emergency, ems, enzgrap2, enzyme, infarct, medicine, nursing, pathology, sgot, surgery, thorax, vascular, stock illustration, royalty free illustrations, stock clip art icon, stock clipart icons, logo, line art, EPS picture, pictures, graphic, graphics, drawing, drawings, vector image, artwork, EPS vector arts, fine art prints, print, poster, posters, mural, wall murals, sa701013
Show Keywords
- Low Resolution (37.2 MB)45.1" x 55.6" @ 72dpi JPG45
- Vector EPS (Scalable to any size)Scalable Vector68
View larger image sizes
View LifeART license agreement

